Loading...
QUESTIONS? CALL 1-800-448-4919 M-F 9AM-6PM EST

Body Mass Index (BMI)

Body Mass Index (BMI) is the measurement of choice for many health care practitioners and researchers studying obesity. BMI uses a mathematical formula that takes into account both a person’s weight and height (the formula is your weight in kilograms divided by your height in meters squared).
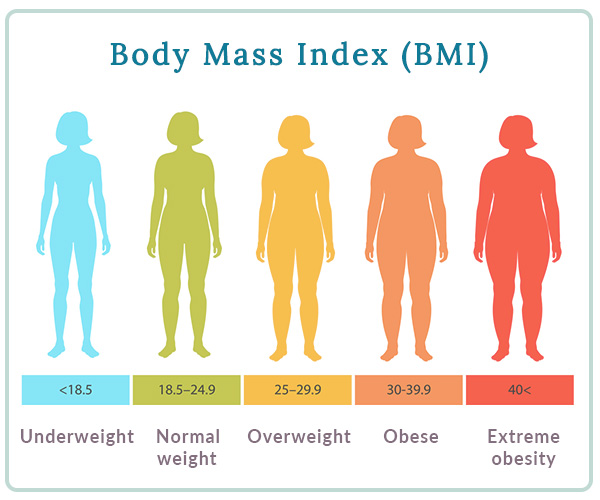
You can find your BMI on the chart below using your height in feet and inches and your weight in pounds.

Bear in mind that while the BMI chart can give you a rough idea of whether you’re at your optimal weight, the BMI formula does not factor your total body fat, muscle, or and water into the overall health equation. This is addressed more holistically by bioimpedence analysis models.

Some researchers observe that the waist-to-hip ratio is a more accurate means than the BMI for determining cardiovascular disease risk. Waist-to-hip ratio is easily calculated by dividing your waist measurement by your hip measurement. The cut-off limit for risk is <0.85 for women, and <0.90 and below for men. A ratio higher than these figures indicates a greater risk for cardiovascular disease.

bmi header
5’0″ 5″1″ 5’2″ 5’3″ 5’4″ 5’5″ 5’6″ 5’7″ 5’8″ 5’9″ 5’10” 5’11” 6’0″ 6’1″ 6’2″ 6’3″ 6’4″
100
20
19
18
18
17
17
16
16
15
15
14
14
14
13
13
12
12
105
21
20
19
19
18
17
17
16
16
16
15
15
14
14
13
13
13
110
21
21
20
19
19
18
18
17
17
16
16
15
15
15
14
14
13
115
22
22
21
20
20
19
19
18
17
17
17
16
16
15
15
25
14
120
23
23
22
21
21
20
19
19
18
18
17
17
16
16
15
15
15
125
24
24
23
22
21
21
20
20
19
18
18
17
17
16
16
16
15
130
25
25
24
23
22
22
21
20
20
19
19
18
18
17
17
16
16
135
26
26
25
24
23
22
22
21
21
20
19
19
18
18
17
17
16
140
27
26
26
25
24
23
23
22
21
21
20
20
19
18
18
17
17
145
28
27
27
26
25
24
23
23
22
21
21
20
20
19
19
18
18
150
29
28
27
27
26
25
24
23
23
22
22
21
20
20
19
19
18
155
30
29
28
27
27
26
25
24
24
23
22
22
21
20
20
19
19
160
31
30
29
28
27
27
26
25
24
24
23
22
22
21
21
20
19
165
32
31
30
29
28
27
27
26
25
24
24
23
22
22
21
21
20
170
33
32
31
30
29
28
27
27
26
25
24
24
23
22
22
21
21
175
34
33
32
31
30
29
28
27
27
26
25
24
24
23
22
22
21
180
35
34
33
32
31
30
29
28
27
27
26
25
24
24
23
22
22
185
36
35
34
33
32
31
30
29
28
27
27
26
25
24
24
22
23
190
37
36
35
34
33
32
31
30
29
28
27
26
26
25
24
23
23
195
38
37
36
35
33
32
31
31
30
29
28
27
26
26
25
24
24
200
39
38
37
35
34
33
32
31
30
30
29
28
27
26
26
24
24
205
40
39
37
36
35
34
33
32
31
30
29
29
28
27
26
25
25
210
41
40
38
37
36
35
34
33
32
31
30
29
28
28
27
26
26
215
42
41
39
38
37
36
35
34
33
32
31
30
29
28
28
26
26
220
43
42
40
39
38
37
36
34
33
32
32
31
30
29
28
27
27
225
44
43
41
40
39
37
36
35
34
33
32
31
31
30
29
27
27
230
45
43
42
41
39
38
37
36
35
34
33
32
31
30
30
28
28
235
46
44
43
42
40
39
38
37
36
35
34
33
32
34
30
29
29
240
47
45
44
43
41
40
39
38
36
35
34
33
33
32
31
30
29
245
48
46
45
43
42
41
40
38
37
36
35
34
33
32
31
31
30
250
49
47
46
44
43
42
40
39
38
37
36
35
34
33
32
31
30
bmi pink Underweight bmi grey Weight appropriate bmi blue  Overweight bmi purple
Obese
References

Yusuf, S., et al. 2005. Obesity and the risk of myocardial infarction in 27,000 participants from 52 countries: A case-control study. The Lancet, 366 (9497), 1640–1649.

Last Updated: January 19, 2022
Back
on top